
Container haulage article
Cut UK Truck Turnaround Times with Live Port Data and Admin Fixes
Use live port dashboards, national stats, and admin fixes to spot queues before dispatch and reduce UK truck turnaround delays.


Check port and terminal live dashboards for gate-in/gate-out timestamps before you dispatch, and confirm or re-slot your appointment window if the queue looks long. Turnaround time, in planning terms, runs from gate-in to gate-out at a terminal or depot. Port operators, terminal community systems, and appointment platforms all publish some version of this data. Cross-check it against your booked slot before a driver leaves the yard.
HaulierMake Container Transport More VisibleHaulier connects you with UK hauliers through an AI-assisted, human-backed transport desk, supporting clearer quotes and transport updates.Visit HaulierTL;DR:
- Real-time dashboards show that gate-to-gate turnaround times are most useful in the last 60 minutes before dispatch, rather than daily averages.
- External factors like weather, customs delays, and peak demand can cause sudden queues, making it essential to monitor live data rather than rely on averages.
- Depot layout, staffing, vessel scheduling, and driver facilities have a significant impact on turnaround, often more than technology or process changes.
- GPS probe tracking can identify specific delay causes within the terminal, providing more accurate diagnostics than traditional gate-to-gate averages.
- Managing administrative tasks and communication before the truck arrives, through shared visibility and flexible booking systems, can significantly reduce delays.
Table of Contents
- Where to find live UK truck turnaround and terminal status data
- What UK benchmarks and national statistics actually tell you
- What actually drives turnaround up or down at ports and depots
- How turnaround time is actually measured, and where the numbers mislead you
- Practical steps to reduce or manage turnaround impact
- Why the admin, not the driving, is usually the real bottleneck
- How Haulier helps when turnaround is the unpredictable part of your day
- Sources
- FAQ
Where to find live UK truck turnaround and terminal status data
Several UK port operators run public status pages that update through the day. Peel Ports, for instance, publishes gate-to-gate turnaround figures for the Port of Liverpool, refreshed roughly every 30 minutes, showing arrivals and average waits for a rolling window rather than a daily average.
That distinction matters when you’re reading these dashboards. A “last 60 minutes” figure tells you what’s happening right now, which is what you need before dispatching a driver. A daily or weekly average tells you almost nothing about the next three hours.
The fields worth watching:
- Hourly arrivals — a spike against normal volumes usually precedes a queue building within the hour.
- Queue length or current wait — the most direct predictor of imminent delay.
- Vessel ETAs — late or bunched vessel arrivals push a wave of collection demand into a short window.
- Gate status flags — some terminals flag temporary closures or system issues that standard averages won’t show.
Terminal community portals and haulier-facing booking systems often carry the same data in a different format, so check whichever source your regular terminal actually keeps current.
What UK benchmarks and national statistics actually tell you
There is no single “normal” turnaround figure for UK facilities, and treating one as a target is a mistake. Industry guidance sometimes cites turnaround times of under 30 minutes as a strong result for certain container operations, but many UK depots and terminals report longer dwell ranges depending on cargo type, gate complexity, and time of day.
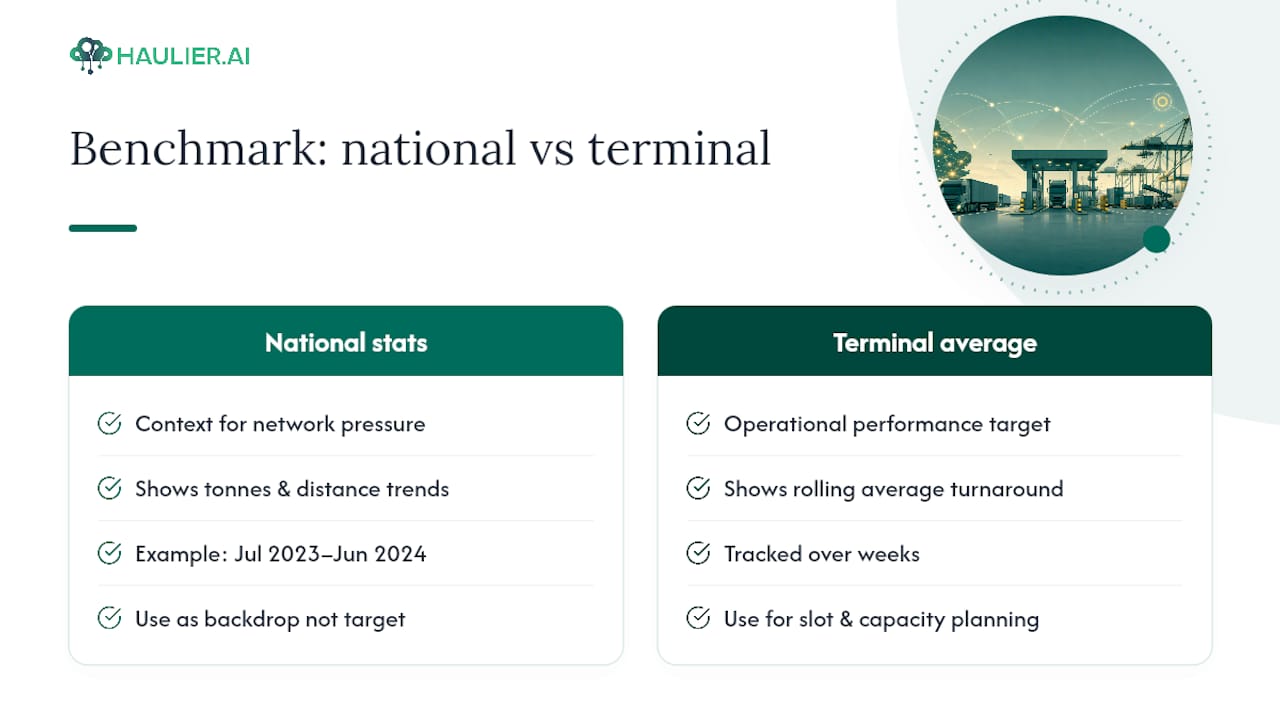
The Department for Transport’s domestic road freight statistics for July 2023 to June 2024 give the clearest national picture of HGV activity trends, covering tonnes lifted and distance travelled by GB and Northern Ireland registered vehicles. That data won’t hand you a turnaround benchmark for your specific terminal, but it does show whether the network as a whole is under more or less pressure than the previous year, which is useful context when you’re negotiating slot times or planning capacity.
Use it as a backdrop, not a yardstick. The right comparison is always your own terminal’s rolling average, tracked over weeks, not a published national figure.
What actually drives turnaround up or down at ports and depots
Terminal processes are the obvious starting point. Gate checks, yard stacking moves, and staffing levels on a given shift all add or strip minutes, and vessel bunching (several ships unloading into the same window) can overwhelm a gate that otherwise runs fine on a normal day.
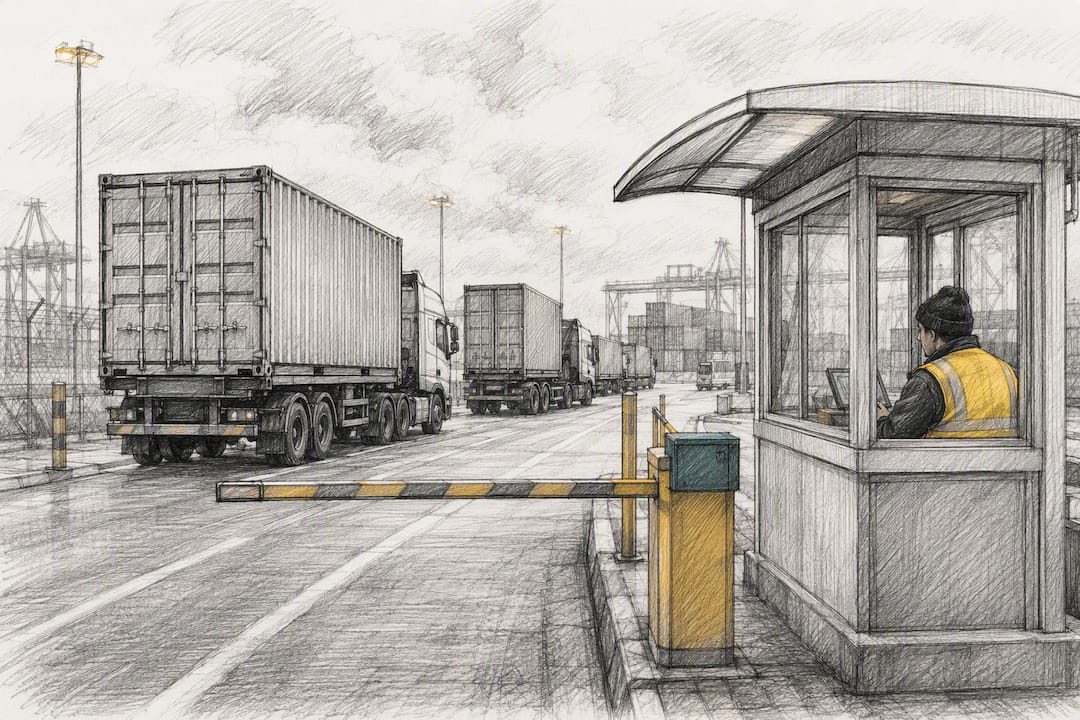
Depot and warehouse layout matters just as much, and it’s often overlooked. Poor flow between packing stations and dispatch bays, or badly placed staging areas, adds avoidable minutes to every single movement, according to HGV UK’s analysis of depot layout and turnaround. Fixing that is usually cheaper than any technology purchase.
Driver-side constraints are harder to solve locally. Parliamentary evidence on port operations has drawn direct links between driver facilities, planning, and lorry parking shortfalls and recurring delays, and separate DfT-commissioned lorry parking audits found high utilisation of night-time parking across several regions. A driver who can’t find a legal rest stop near a port isn’t going to arrive on time the next morning, whatever your appointment system says.
External disruption rounds out the list: weather, customs holds, and peak-season demand spikes all compress the same gate capacity into fewer effective hours. None of these are new problems, but they interact, which is why a “quiet” Tuesday can turn into a three-hour queue with almost no warning.
- Terminal processes: gate checks, yard moves, staffing, vessel bunching
- Depot layout: packing-to-bay flow, staging area placement
- Driver-side: parking availability, rest compliance, route planning
- External: weather, customs delays, seasonal peaks
Pro Tip: Track your own terminal’s turnaround by day of week for a month before you assume Monday mornings or Friday afternoons are your worst slots. Most operators guess wrong.
How turnaround time is actually measured, and where the numbers mislead you
Gate-in to gate-out only measures time inside the terminal. It says nothing about how long a driver sat queueing on the approach road before reaching the gate, which is often the larger share of total wait during a congestion spike.
GPS-probe methods close that gap. Research on measuring truck service times using GPS data inside container terminals shows that probe-based tracking can isolate exactly which service step causes a delay, customs, a refrigerated check, an empty container drop, without needing any cooperation from the terminal operator itself. That’s a meaningfully different diagnostic tool than a published gate-to-gate average.
Two practical pitfalls to watch for when comparing figures across sources:
- Some published averages strip out “trouble time” (breakdowns, system faults), others don’t, so a lower number isn’t always a better one.
- Mean and median turnaround can diverge sharply when a handful of long outlier visits skew the average upward.
For day-to-day dispatch decisions, watch the live gate dashboard. For strategic planning, capacity negotiation, or diagnosing a chronic problem, GPS-probe or granular service-time data gives you a far more honest picture.
Practical steps to reduce or manage turnaround impact
Start with what you control before dispatch. Check the live dashboard for your destination terminal, confirm your appointment window is still valid, and pre-lodge customs paperwork where the process allows it, since a hold at the gate for missing documentation is one of the most avoidable delays in the whole system. Haulier’s guide to transit times and customs pre-lodgement covers this in more detail.
- Fix the depot flow first. Align packing stations to dispatch bays and fix staging order before spending on anything else. Layout changes at the depot routinely produce the biggest single improvement for the smallest cost.
- Share ETAs proactively. Terminals and depots that get early notice of arrival timing can smooth their own staffing and yard moves, which shortens your wait too.
- Negotiate or adopt appointment systems wherever the terminal offers one, and build in dynamic re-slotting so a delayed driver isn’t locked into a slot they’ll now miss.
- Measure what’s actually happening. Combine gate timestamps with GPS probe data if you can, and set an internal alert threshold, for example, flag any visit running 50% over your rolling average, so problems surface before they become a pattern.
Pro Tip: Modelling at constrained ports has shown that adding just three to five minutes to check-in processing can push a site past its capacity threshold entirely, producing queues that grow rather than clear, according to the Port of Dover simulation study. Flexible buffer space handles that better than adding a fixed extra lane.
Why the admin, not the driving, is usually the real bottleneck
Most turnaround conversations focus on gates, yards, and vessel schedules. Fewer focus on the paperwork and communication gaps that happen well before a truck reaches any gate, missed updates between a forwarder and a haulier, a job accepted that never should have been, a document chased by phone an hour before a slot closes.
A platform can give customers and hauliers shared visibility on quoting, booking, and paperwork status through an AI-assisted, human-backed transport desk, which cuts the number of avoidable admin delays that turn into missed slots. Because hauliers can keep control over their own rates and decline unsuitable jobs, fewer bookings end up as no-shows or last-minute reshuffles, the kind of failure that never shows up on a terminal’s gate dashboard but still wrecks a day’s schedule. Expect fewer missed updates and less paperwork chasing as the direct, measurable improvement.
— Vytautas
How Haulier helps when turnaround is the unpredictable part of your day
You can’t control a terminal’s gate queue, but you can control how much admin friction sits either side of it. A transport desk that tracks paperwork and communication in real time can help ensure a driver isn’t stuck waiting on a document that should have been sorted the day before.
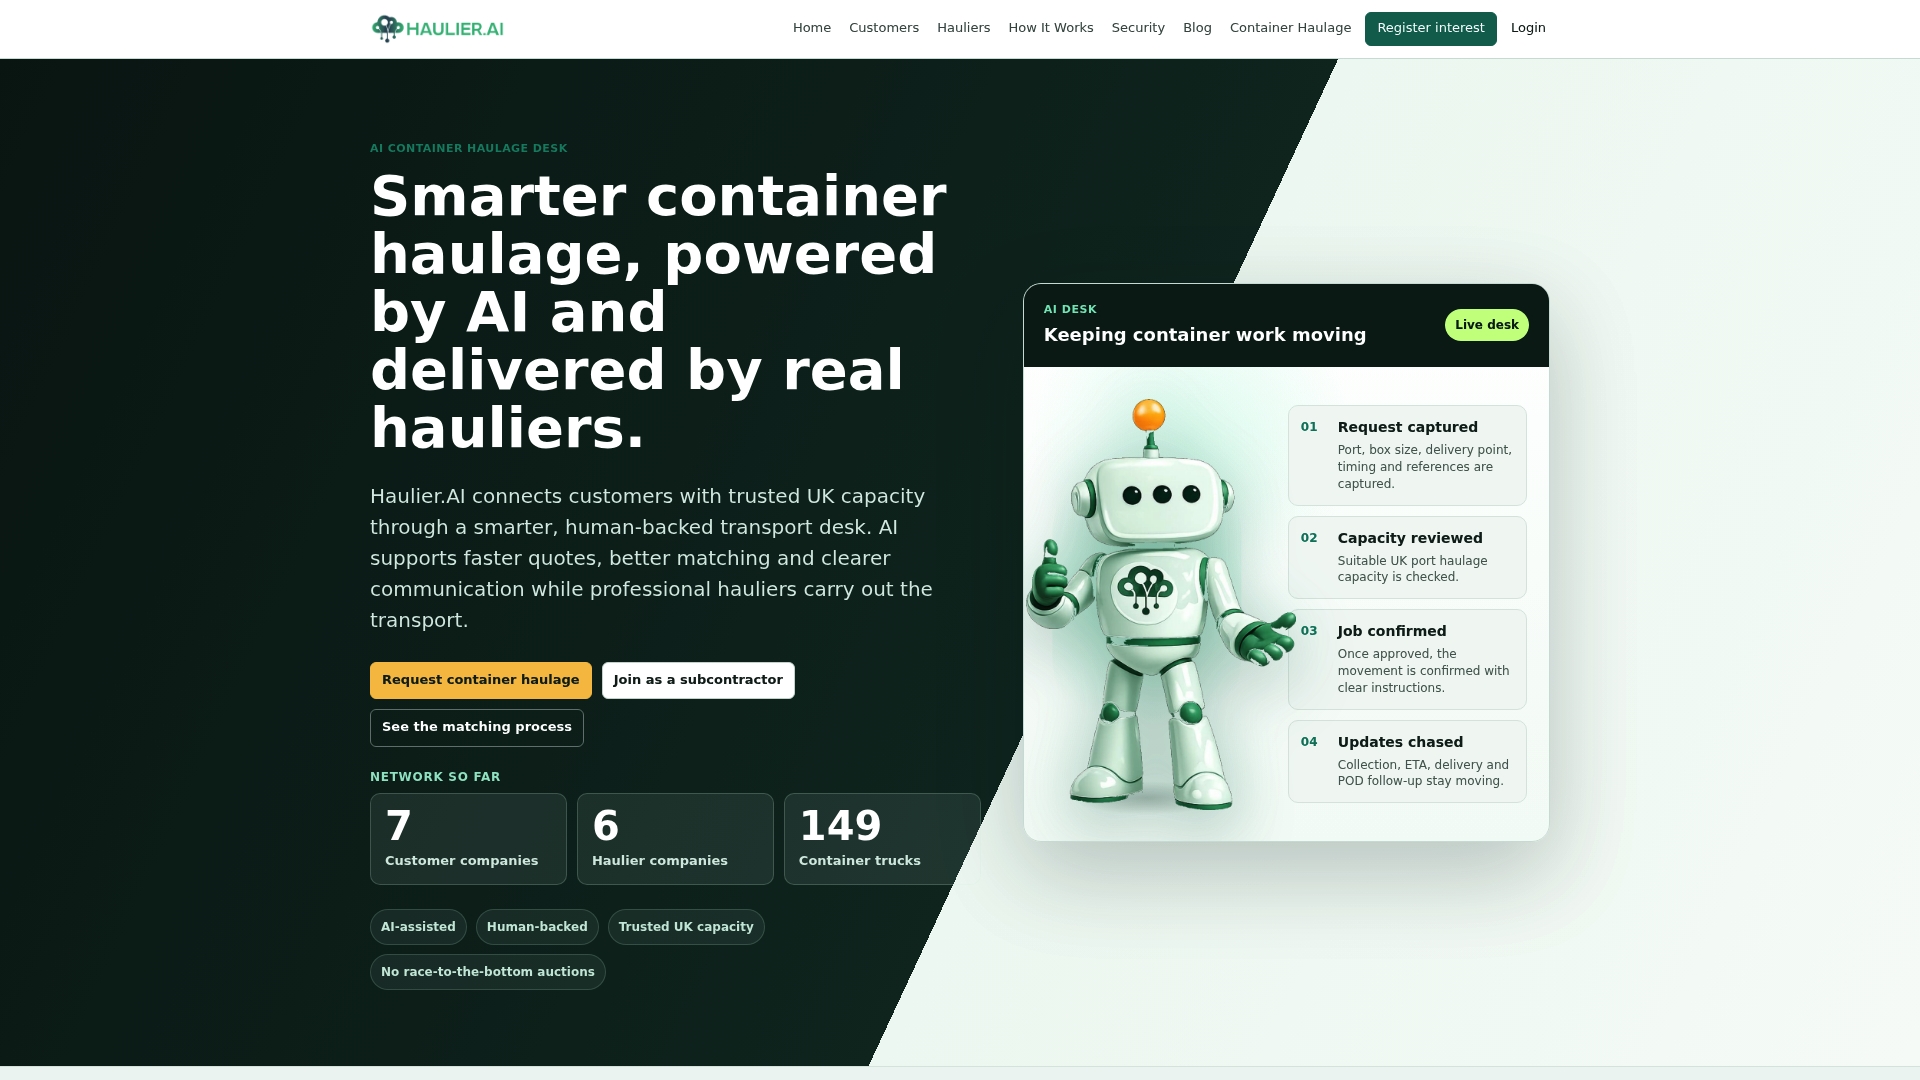
Hauliers can keep control of their own rates and turn down jobs that don’t suit their fleet or route, which means fewer no-shows and fewer wasted trips on either side. If you’re a freight forwarder or importer tired of chasing updates by phone, request container haulage through Haulier and see how the transport desk handles a live booking. If you want the mechanics first, the platform overview walks through exactly what happens between quote and gate-out.
Sources
- Domestic road freight statistics: July 2023 to June 2024 (United Kingdom)
- Parliamentary oral evidence on port operations and haulage
- How depot layout and packing stations impact HGV turnaround times | HGV UK.com
- Masterplanning at the Port of Dover: The Use of Discrete-Event Simulation in Managing Road Traffic
FAQ
What counts as truck turnaround time at a UK port?
It’s typically measured from gate-in to gate-out at the terminal, covering checks, yard moves, and loading or unloading, but it excludes any queueing time on the approach road outside the gate.
Is there a shortage of truck drivers in the UK?
Driver availability has been a recurring constraint reported in DfT statistics and industry evidence, and it directly affects scheduling flexibility and turnaround predictability. Haulier’s guide to the HGV driver shortage covers the planning implications in more depth.
How long is a 44 tonne lorry?
A standard articulated lorry in the UK typically runs to around 16 metres overall length, though exact figures vary by trailer configuration and axle setup.
What is the biggest trucking company in the UK?
Several large logistics groups operate substantial UK HGV fleets, and market position shifts with contracts and fleet investment, so there’s no single fixed answer that holds year to year.
Who sells the most trucks in the UK?
New HGV registrations in the UK are dominated by a handful of major manufacturers, with market share shifting annually depending on fleet renewal cycles and fuel type demand.